


ABLLS-R Tracking Sheet & Scoring Dashboard, ABLLS-R Assessment, ABLLS-R Excel & Google Sheets Data Tracking & Visual Graphs
Soulful Systems
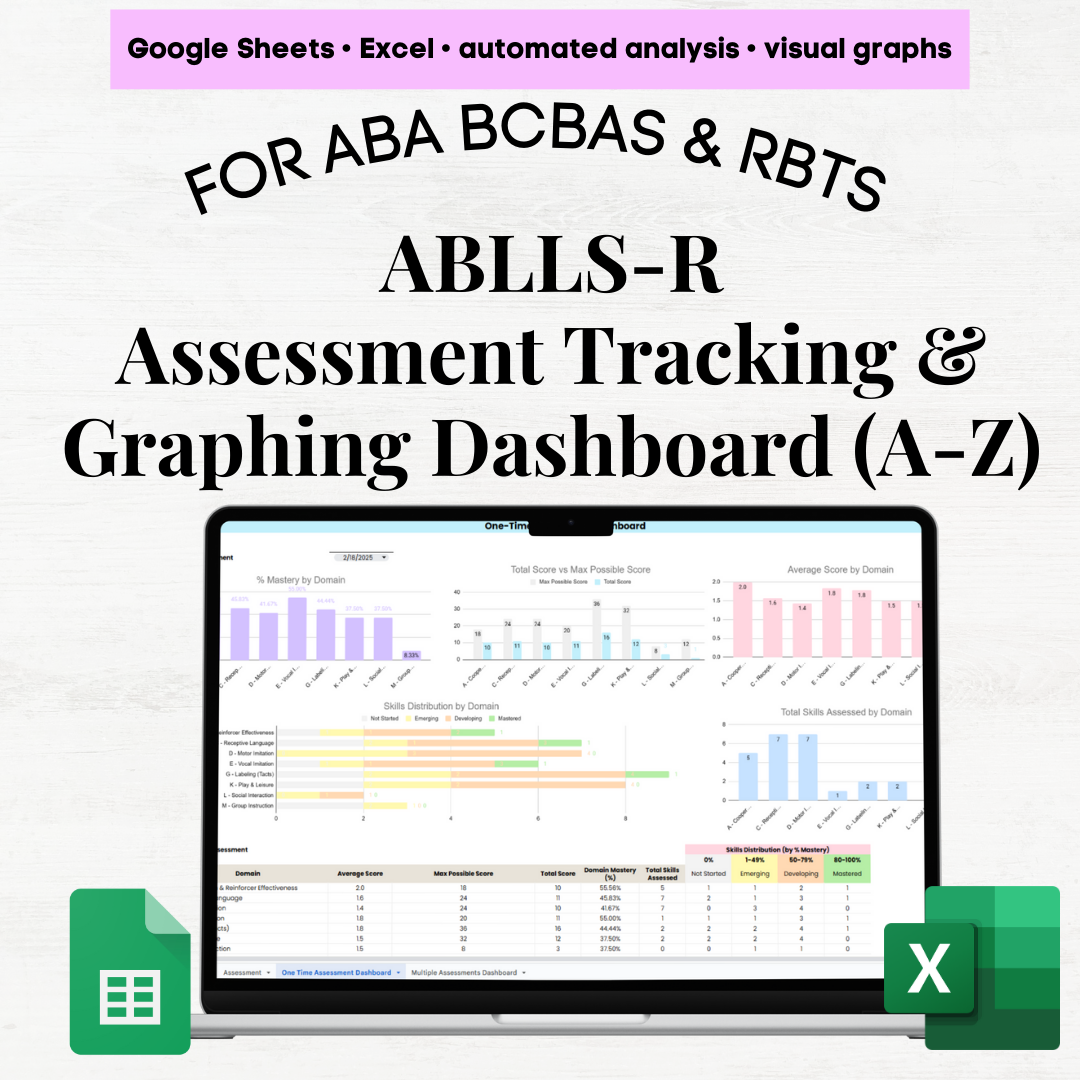
✨ ABLLS-R Scoring Grid & Assessment Dashboard (Excel)
Full Version – Domains A–Z ✨
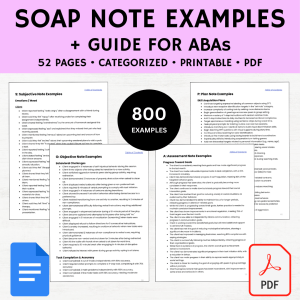
Stop juggling paper scoring sheets and manually coloring cells just to understand progress. This all-in-one ABLLS-R assessment and analytics system brings scoring, tracking, and visual insights together in one fully automated Excel workbook—so you can focus on assessment and reporting, not spreadsheets.
Designed with BCBAs, clinicians, and educators in mind, this tool is intuitive even for spreadsheet beginners, with built-in safeguards to prevent scoring errors and instantly generate meaningful visuals.
📂 What’s Included (4 Tabs)
⚙️ 1. Set Up Tab
Customize the system to fit your practice:
-
Edit domain names
-
Adjust mastery thresholds and labels (e.g., Emerging, Developing, Mastered)
-
Customize reporting terminology
All dashboards update automatically based on your settings.
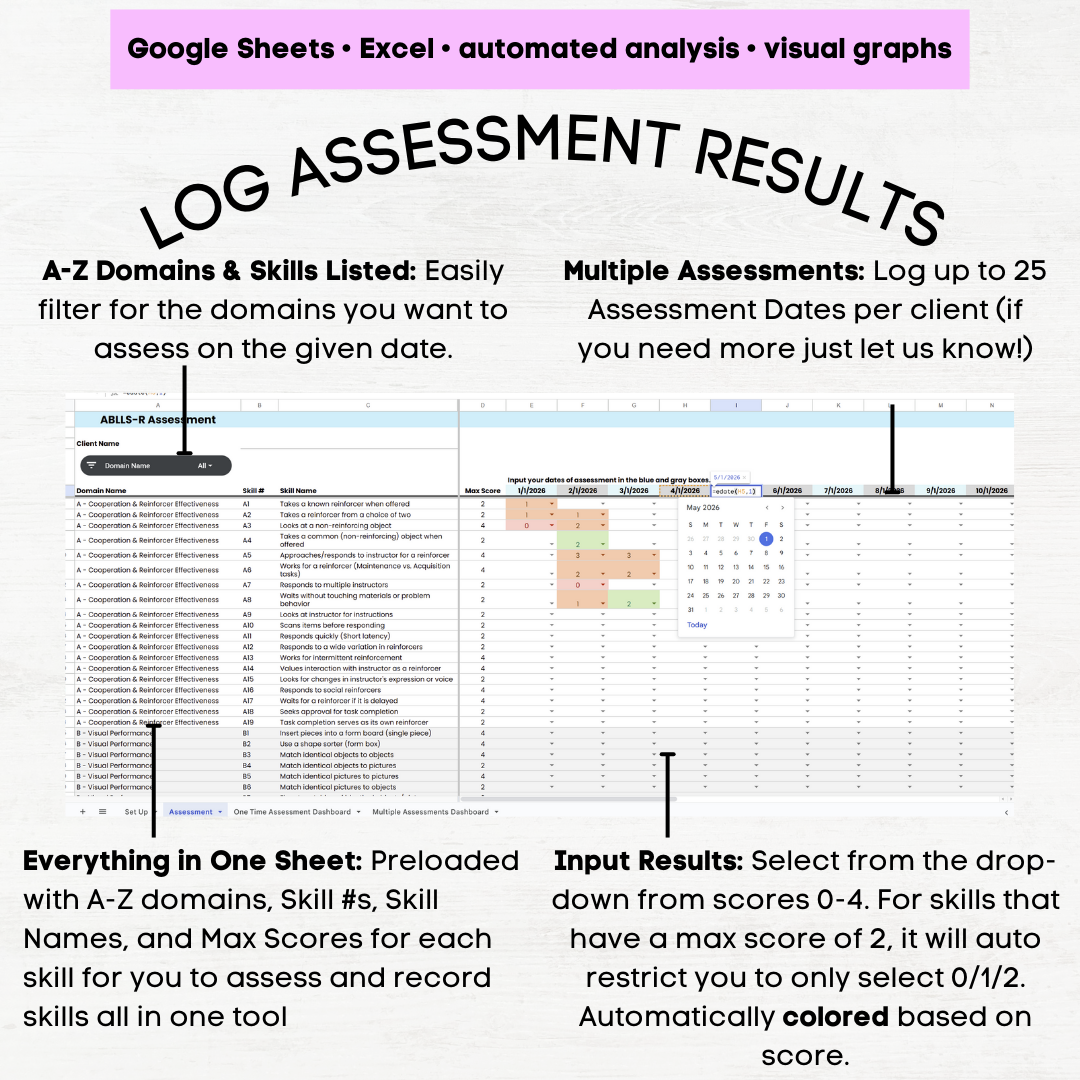
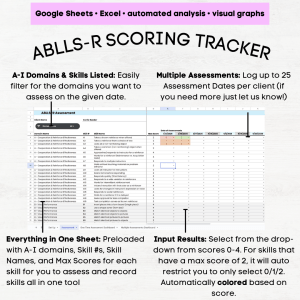
📝 2. Assessment Tab (Domains A–Z – Full Version)
Your primary scoring workspace.
-
Includes all ABLLS-R domains (A–Z)
-
Preloaded skill numbers, brief synthesized skill descriptions, and maximum score per skill
-
Skill descriptions are summarized and not copied from the official ABLLS-R guide
-
Reference the official guide for full definitions of 0–4 scoring
-
-
Log up to 25 assessment dates horizontally
-
Enter scores using drop-downs (0–4) with automatic score limits
-
Skills with a max score of 2 cannot be scored higher
-
-
Built-in filters / slicers to assess only selected domains on a given day
-
Clean layout with a step-by-step PDF instruction guide included
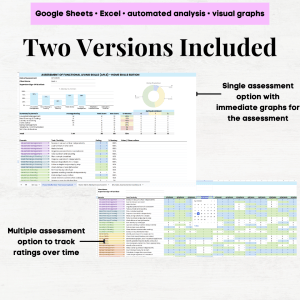
📊 Analytics & Dashboards
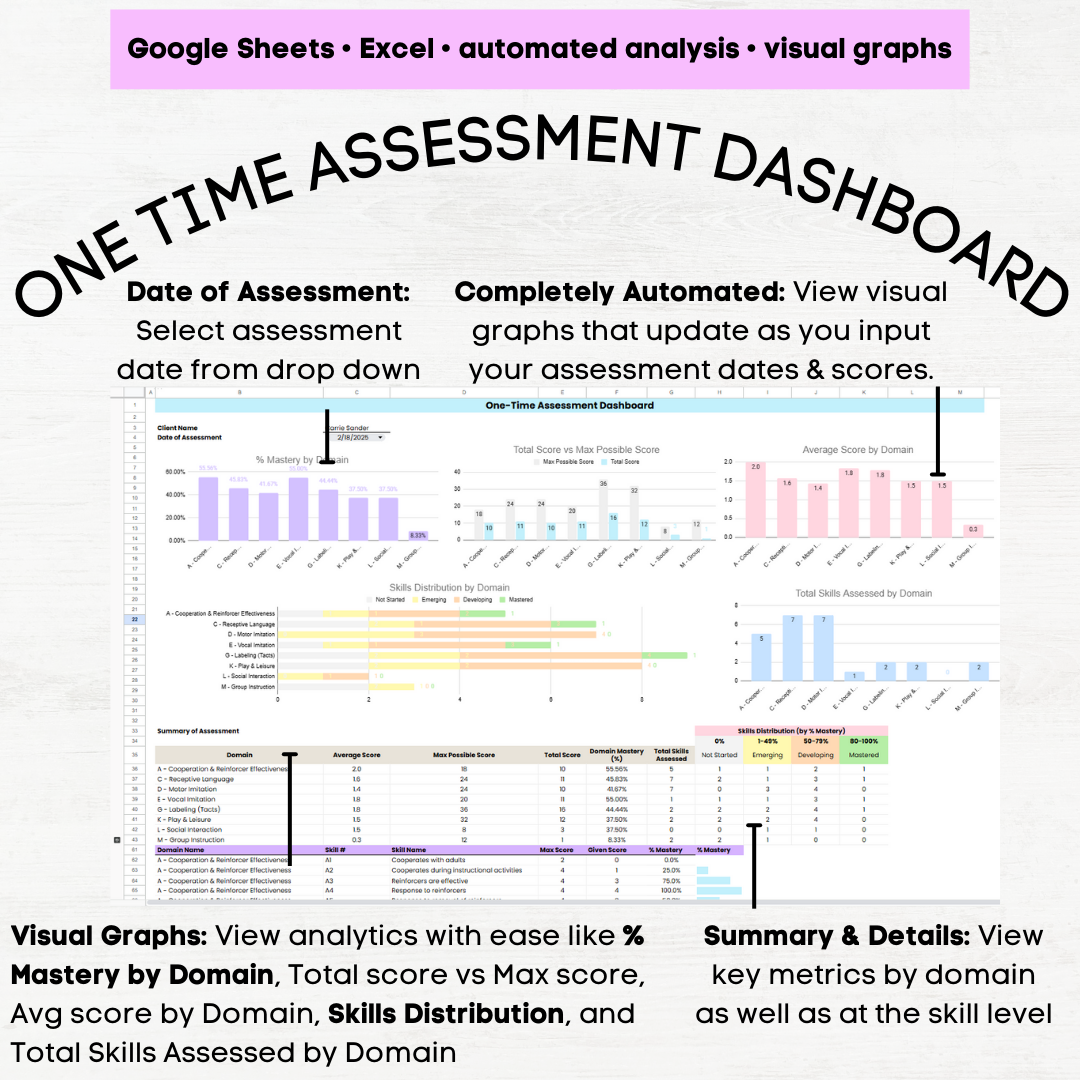
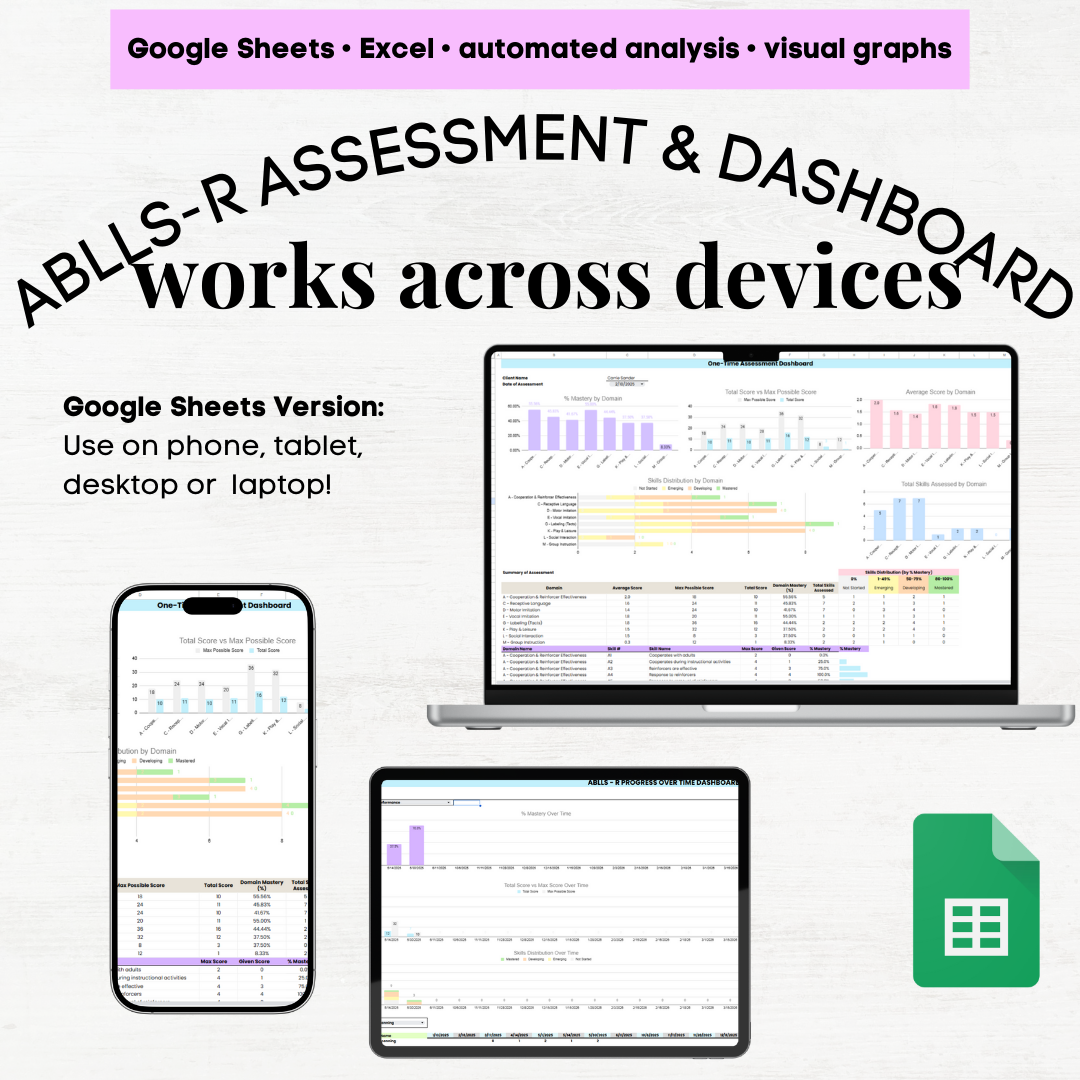
📈 3. One-Time Assessment Dashboard
Filter to a single assessment date and instantly view:
-
% mastery by domain (for domains assessed that day)
-
Total score vs maximum possible score
-
Average score by domain
-
Skill distribution by domain, including:
-
Not Started (0%)
-
Emerging (1–49%)
-
Developing (50–79%)
-
Mastered (80–100%)
-
-
Number of skills assessed by domain
(Customizable labels and % thresholds in the Set Up tab)
Includes:
-
A domain-level summary table
-
A detailed skill-level breakdown for deeper review
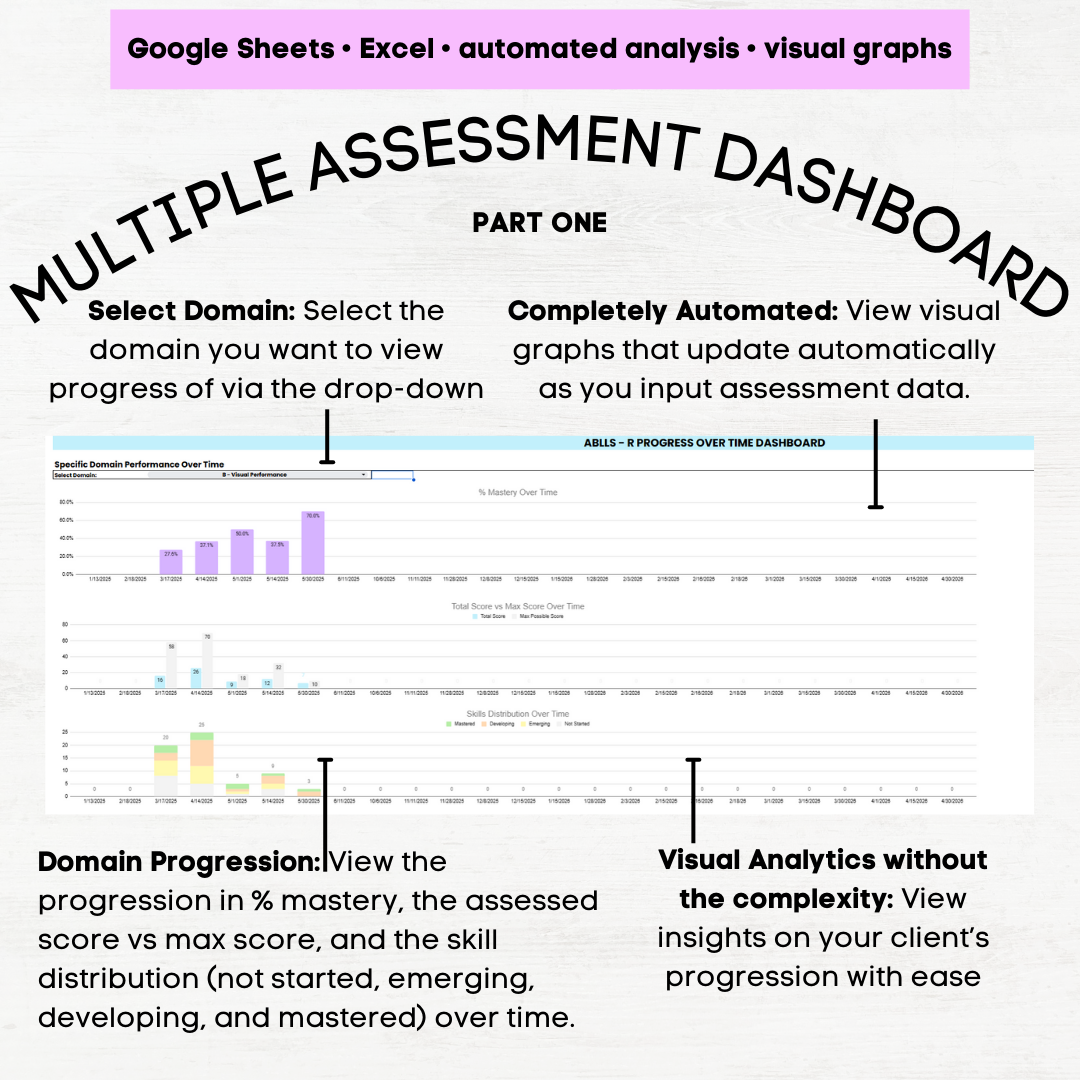
📉 4. Multiple Assessments Dashboard (Progress Over Time)
Designed for progress monitoring and reporting.
Section 1: Domain Focus
Filter to a specific domain to view:
-
% mastery over time
-
Total score vs max score over time
-
Skill distribution trends
-
Progress of a specific skill across assessment dates
Section 2: Domain Comparison
-
Compare % mastery across multiple domains over time
-
Automatically color-coded summary table for quick interpretation
Section 3: Assessment Volume
-
Number of skills assessed by domain
-
Total skill assessments completed over time
-
Summary table showing skills assessed per domain across assessment dates
💡 Why You’ll Love It
-
All-in-one ABLLS-R scoring grid, tracking sheets, and dashboards
-
No more manual scoring or coloring cells ✋
-
Automated % mastery, totals, averages, and distributions
-
Built-in score restrictions to prevent data entry errors
-
Clear visuals for reporting to caregivers, teams, and stakeholders
-
Works seamlessly in Excel
-
Designed for clinicians and spreadsheet beginners
$31.99
✨ ABLLS-R Scoring Grid & Assessment Dashboard (Excel)
Full Version – Domains A–Z ✨
Stop juggling paper scoring sheets and manually coloring cells just to understand progress. This all-in-one ABLLS-R assessment and analytics system brings scoring, tracking, and visual insights together in one fully automated Excel workbook—so you can focus on assessment and reporting, not spreadsheets.
Designed with BCBAs, clinicians, and educators in mind, this tool is intuitive even for spreadsheet beginners, with built-in safeguards to prevent scoring errors and instantly generate meaningful visuals.
📂 What’s Included (4 Tabs)
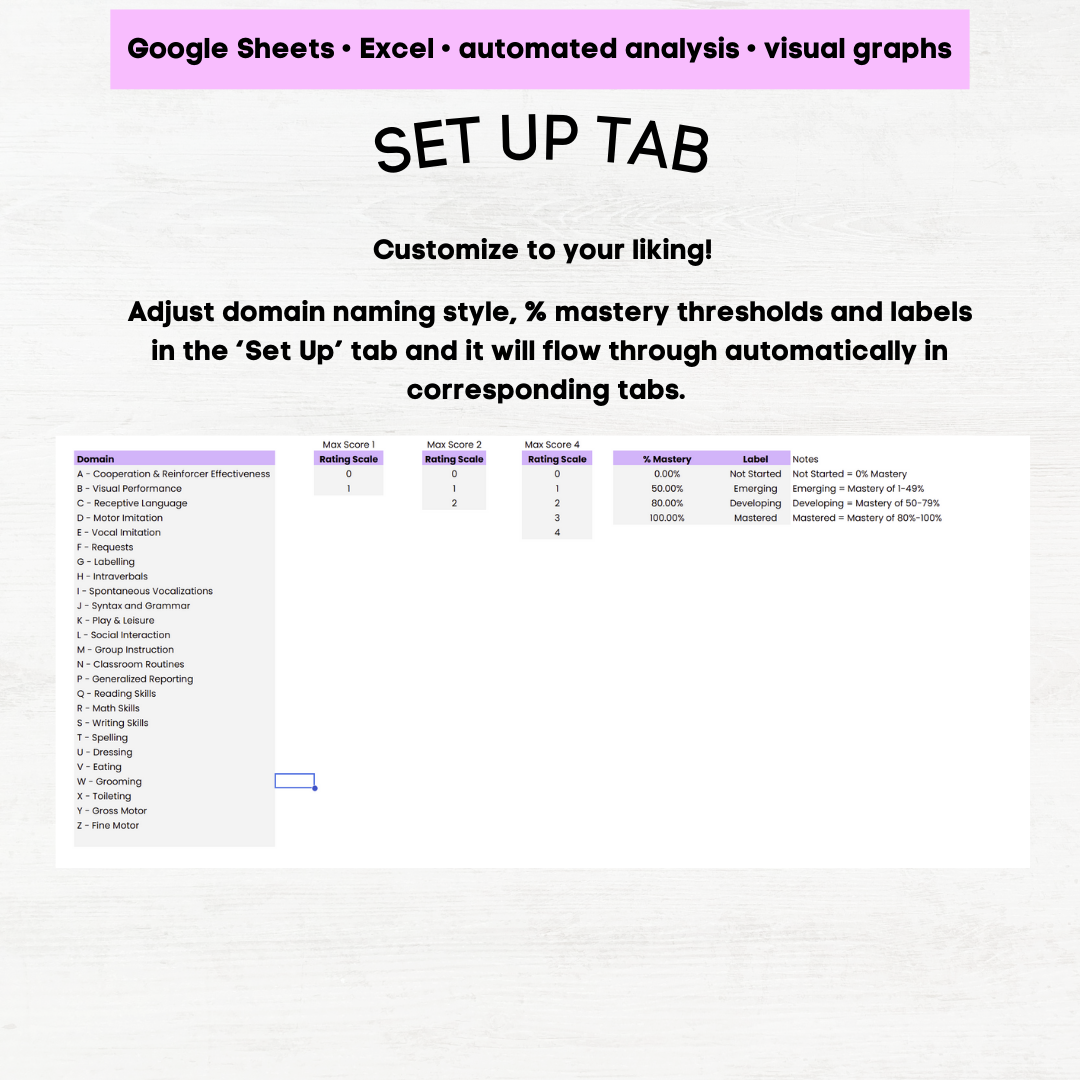
⚙️ 1. Set Up Tab
Customize the system to fit your practice:
-
Edit domain names
-
Adjust mastery thresholds and labels (e.g., Emerging, Developing, Mastered)
-
Customize reporting terminology
All dashboards update automatically based on your settings.
📝 2. Assessment Tab (Domains A–Z – Full Version)
Your primary scoring workspace.
-
Includes all ABLLS-R domains (A–Z)
-
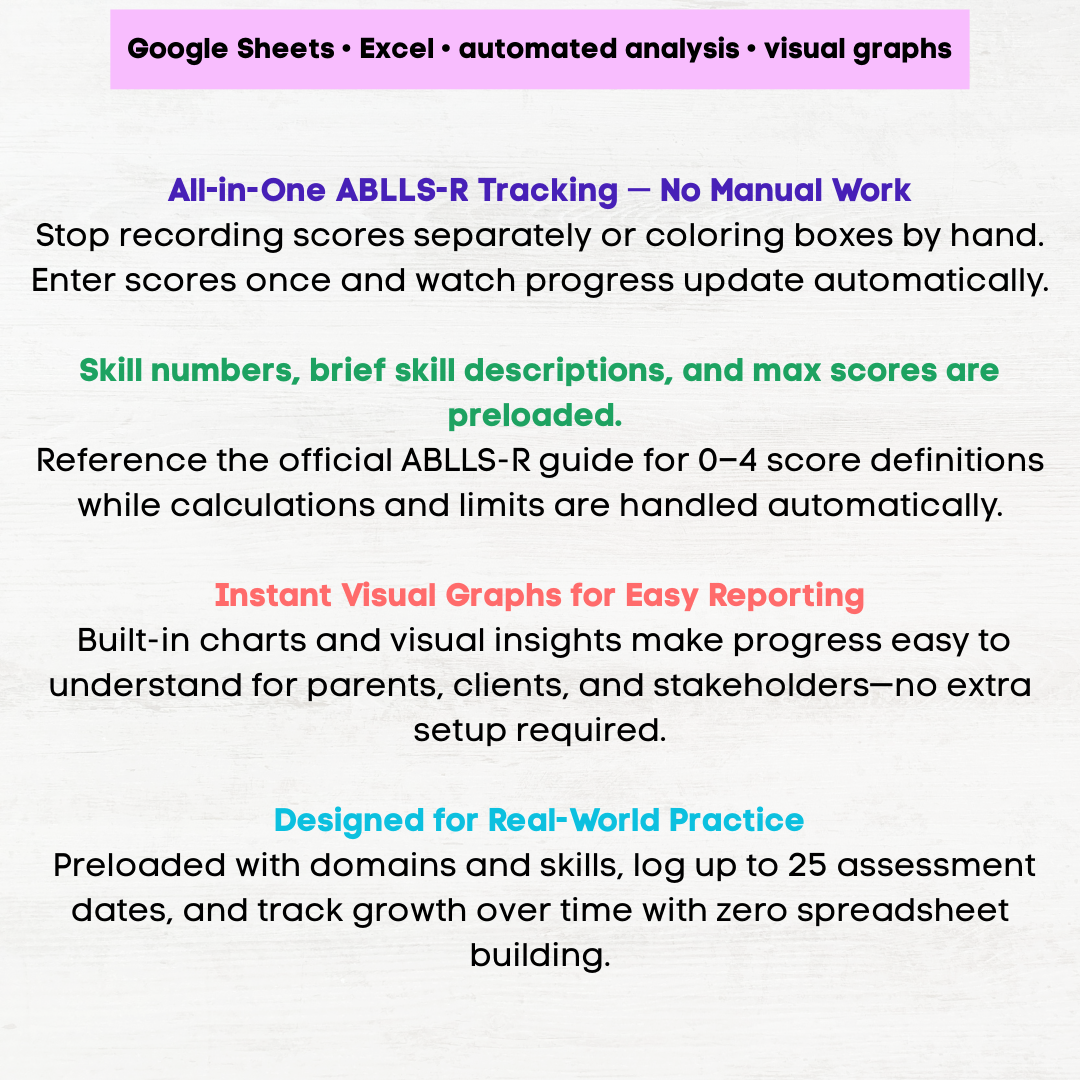
Preloaded skill numbers, brief synthesized skill descriptions, and maximum score per skill
-
Skill descriptions are summarized and not copied from the official ABLLS-R guide
-
Reference the official guide for full definitions of 0–4 scoring
-
-
Log up to 25 assessment dates horizontally
-
Enter scores using drop-downs (0–4) with automatic score limits
-
Skills with a max score of 2 cannot be scored higher
-
-
Built-in filters / slicers to assess only selected domains on a given day
-
Clean layout with a step-by-step PDF instruction guide included
📊 Analytics & Dashboards
📈 3. One-Time Assessment Dashboard
Filter to a single assessment date and instantly view:
-
% mastery by domain (for domains assessed that day)
-
Total score vs maximum possible score
-
Average score by domain
-
Skill distribution by domain, including:
-
Not Started (0%)
-
Emerging (1–49%)
-
Developing (50–79%)
-
Mastered (80–100%)
-
-
Number of skills assessed by domain
(Customizable labels and % thresholds in the Set Up tab)
Includes:
-
A domain-level summary table
-
A detailed skill-level breakdown for deeper review
📉 4. Multiple Assessments Dashboard (Progress Over Time)
Designed for progress monitoring and reporting.
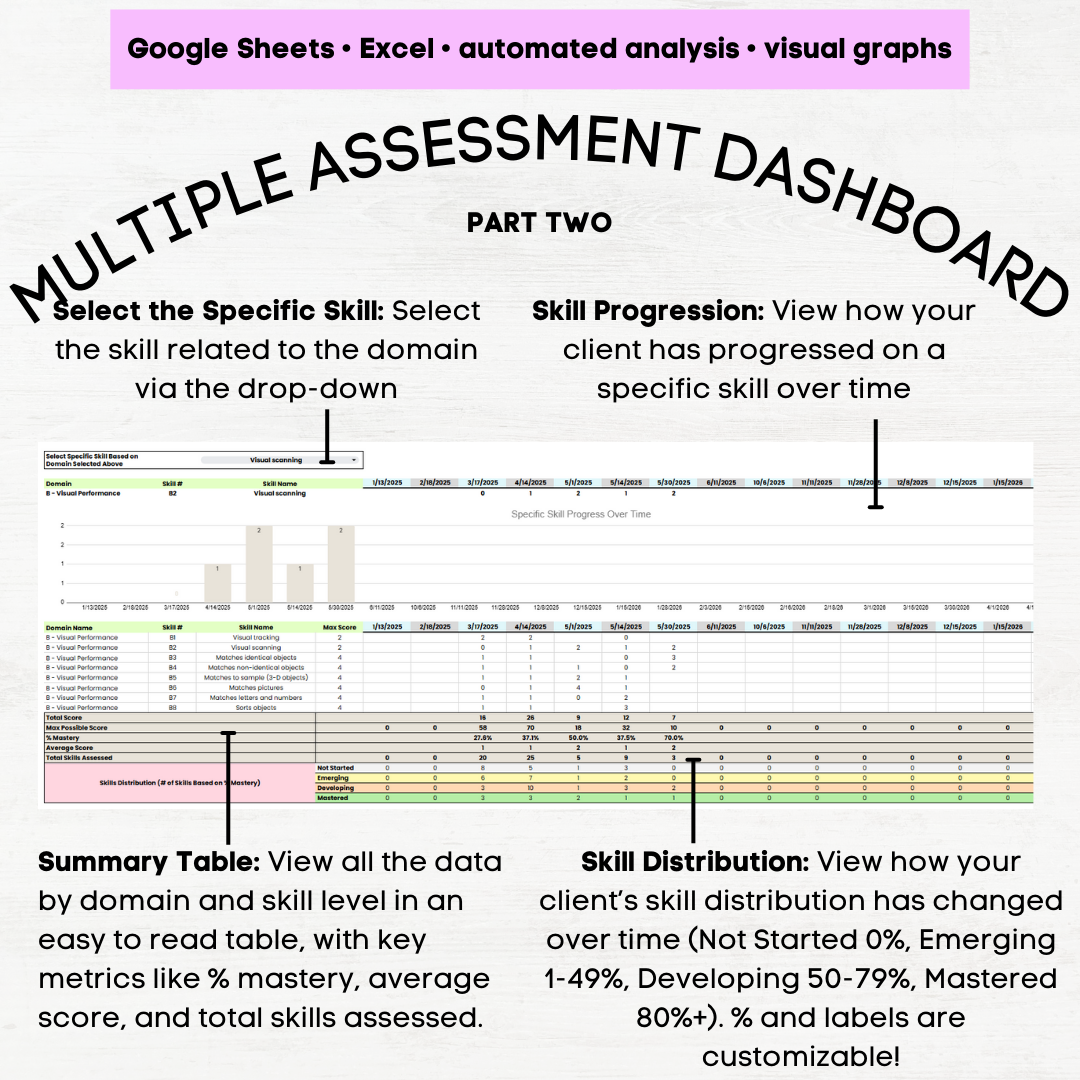
Section 1: Domain Focus
Filter to a specific domain to view:
-
% mastery over time
-
Total score vs max score over time
-
Skill distribution trends
-
Progress of a specific skill across assessment dates
Section 2: Domain Comparison
-
Compare % mastery across multiple domains over time
-
Automatically color-coded summary table for quick interpretation
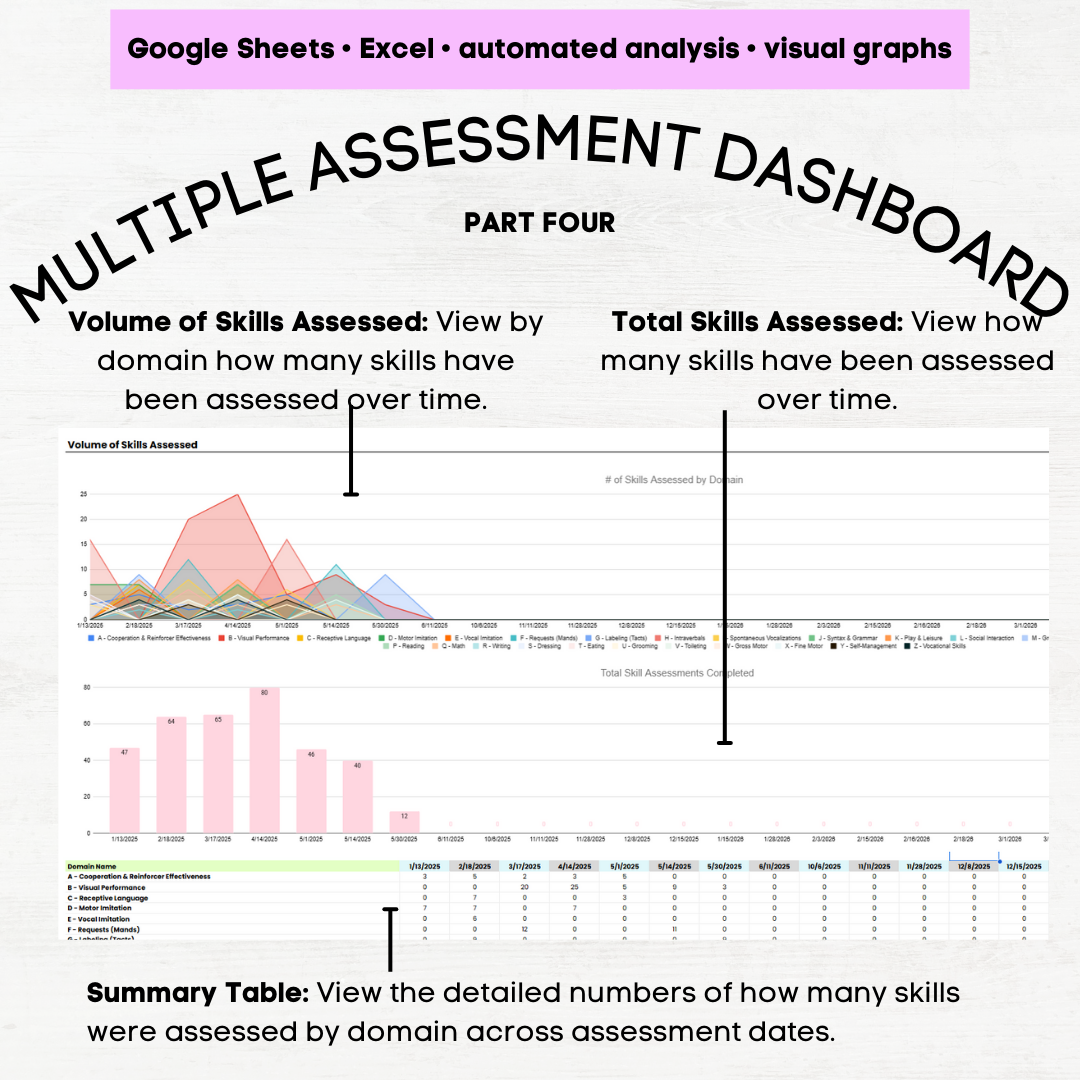
Section 3: Assessment Volume
-
Number of skills assessed by domain
-
Total skill assessments completed over time
-
Summary table showing skills assessed per domain across assessment dates
💡 Why You’ll Love It
-
All-in-one ABLLS-R scoring grid, tracking sheets, and dashboards
-
No more manual scoring or coloring cells ✋
-
Automated % mastery, totals, averages, and distributions
-
Built-in score restrictions to prevent data entry errors
-
Clear visuals for reporting to caregivers, teams, and stakeholders
-
Works seamlessly in Excel
-
Designed for clinicians and spreadsheet beginners
User Reviews
Only logged in customers who have purchased this product may leave a review.


Related Products


$31.99
There are no reviews yet.